
Graphy
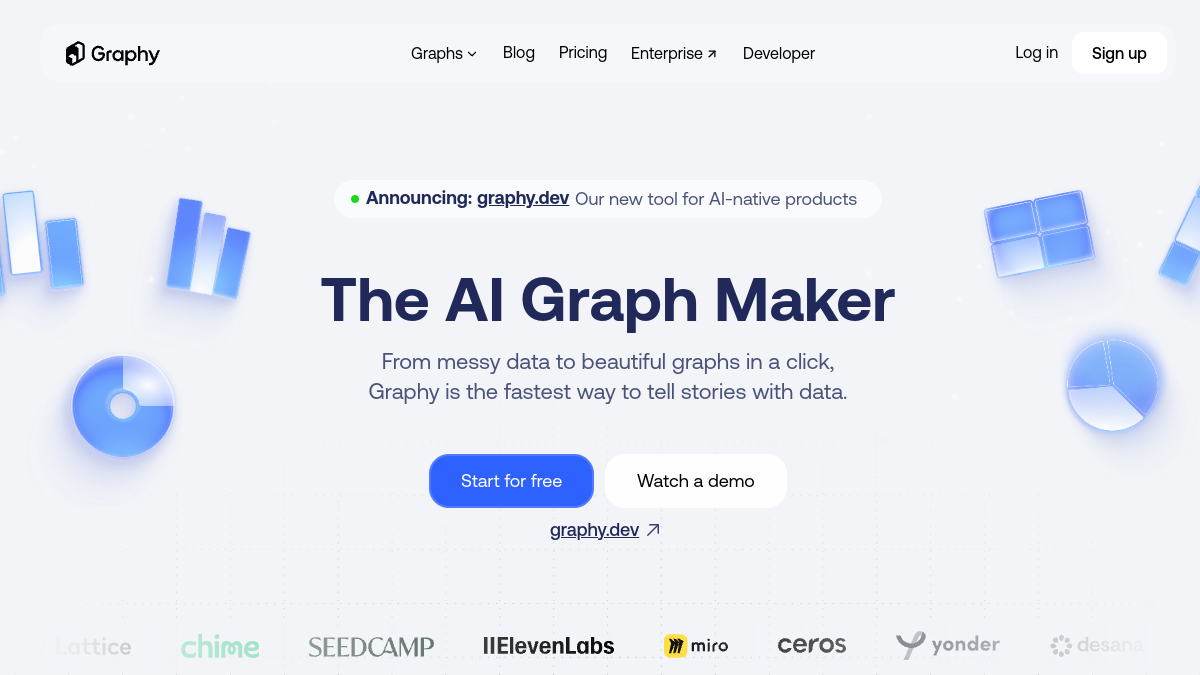
Graphy is an AI-powered online graph and chart maker that transforms raw data into professional, visually appealing visualizations with minimal effort. It's designed to help anyone become a skilled data storyteller.
Key Features
- AI-Powered Insights: Automatically analyzes your data and suggests the most impactful charts with headline take-aways.
- Multiple Data Sources: Supports Google Sheets, CSV, Excel uploads, manual entry, and API integration.
- Wide Range of Chart Types: Creates bar charts, line graphs, pie charts, funnels, heatmaps, tables, and more.
- Customization & Branding: Apply your brand colors, fonts, and styles to all charts instantly.
- Export & Embed: Easily export graphs for use in presentations, social media, documents, or embed them live.
- Interactive Graphs: Create dynamic, interactive visualizations for web use.
- Chat with Data: Use AI to ask questions about your data and get charts or insights on demand.
Use Cases
- Business Reporting: Speed up reporting processes (e.g., reducing 5 days of work to 4 hours).
- Marketing & Social Media: Create engaging visual content for newsletters and social feeds.
- Internal Communications: Share clear insights with stakeholders and team members.
- Presentations: Generate high-quality graphs for slide decks and board memos.
Target Users
Data analysts, marketers, founders, finance professionals, and anyone who needs to communicate data clearly without complex BI tools.